Debugging JavaScript in Chrome
Introduction
One of the biggest hurdles I see new Javascript developers run into, is learning the tools required to debug Javascript code. Unlike traditional compiled languages, which often feature an IDE with robust debugging tools - most Javascript runs on the web and so debugging in an IDE would be futile since many issues will be browser / DOM related rather than simply language / algorithmic issues. This adds an additional layer of complexity, and is in fact one of the most often cited “issues” with Javascript as a language. Your bugs will not be caught as you write them, and you should learn how to use tools like the Chrome developer console, Postman, etc. to find issues with your code. This post focuses on debugging with the Chrome developer console.
Overview
The Chrome developer console (also called developer tools) is a toolkit that ships with the Chrome web browser and can be used for debugging Javascript (and HTML / CSS) issues in your website or application. Firefox and most other major browsers have equivalent tools, but for this tutorial I will focus on Chrome’s toolkit.
Chrome’s developer console can be opened by navigating to “settings” (triple dots) -> “more tools” -> “developer tools”.
Once opened you will see a few tabs at the top, all of whom have a use in Javascript debugging. The tabs as of this post are:
- Elements
- Console
- Sources
- Network
- Performance
- Memory
- Application
- Security
- Audits
Each of these has a purpose, and you can skip around in this post if there is a particular feature set you are interested in learning about. However, for simplicity’s sake I will just go from left to right describing each tab’s usage and providing some example cases.
Elements

The elements tab is where you will spend most of your time debugging HTML and CSS issues. This tab displays the DOM’s current (live) state. This means, after writing your application with HTML + JS and styling it with CSS you will be able to see the final output here. If you have JS code which modifies the state of the DOM when an action occurs, for example “onmouseclick” - the DOM will be reflected instantly after it is modified inside of the elements tab.
You can search through all of the HTML and CSS code you find here with ctrl + f, and it is often useful for looking through the structure of HTML code or seeing if any CSS is being overridden (for example, you write a style: background-color: red and it does not show up, perhaps someone else wrote background-color: blue !important;).
Beyond being able to see the production state of the HTML and CSS code, the developer console is an excellent test-bed for new HTML / CSS tweaks. If you double click any element in the HTML pane, you can modify its properties, attributes, and associated styles in real-time. This is also excellent for faking posts / messages / pages, so don’t trust any screenshots you see on the internet. Yes, you can use developer tools on other people’s websites and apps.
Console

The developer console is where you will spend most of your time debugging your Javascript code. In here, the current state of the application is in scope. You can use this to check console.log() statements, the results of XHR requests and do simple performance testing. Interestingly enough, this tab has a lot of interactions with other tabs. An onmouseclick callback function written inside of the elements tab can display a result in the console. A break line in the sources tab (next section) can pause execution so you can walk through the state of objects in this console. You can also just execute arbitrary Javascript in the console.
Typically, you want to set up your console settings based on what you are trying to debug. By default, XHR statuses (all non-200) are printed to the console. You can disable this by checking “hide network” in the top left.
Most of the time I leave “preserve log” checked, this means in-between page reloads the state of console.log() statements will remain in the console. This is useful for comparing pre/post change console output.
“Selected context only” is an excellent selection for applications that have a lot of communication between components. When this setting is checked, only the currently in context JS code can print to the console. This allows you to be more specific about what logs you want to see.
“LogXMLHTTPRequests” is very straightforward, it toggles the logging of XMLHTTP requests. I leave off unless needed.
The next option “show timestamps” is useful for one thing mainly: simple, quick performance tests. In particular testing HTTP request performance. Here is an example:
$.ajax({
    url: '/users',
    type: 'GET',
    context: this,
    beforeSend: function() {
      console.log('begin request');
    },
    success: function (data) {
      console.log('request completed');
      doThingsToData(data, function() {
        console.log('data processed');
      });
    }
});
If “begin request” log has a 11:49:16:000 timestamp, “request completed” has a 11:49:16:100 timestamp, and “data processed” has a 11:49:16:900 timestamp we can calculate that the HTTP request took 100 milliseconds, and the doThingsToData() function took about 800ms - showing us what part of our code is creating the performance bottleneck.
“Autocomplete from history” just gives you “instant-search” style code-completion.
I would start off getting familiar with the console and elements tabs since they tie in closely to the remaining tabs.
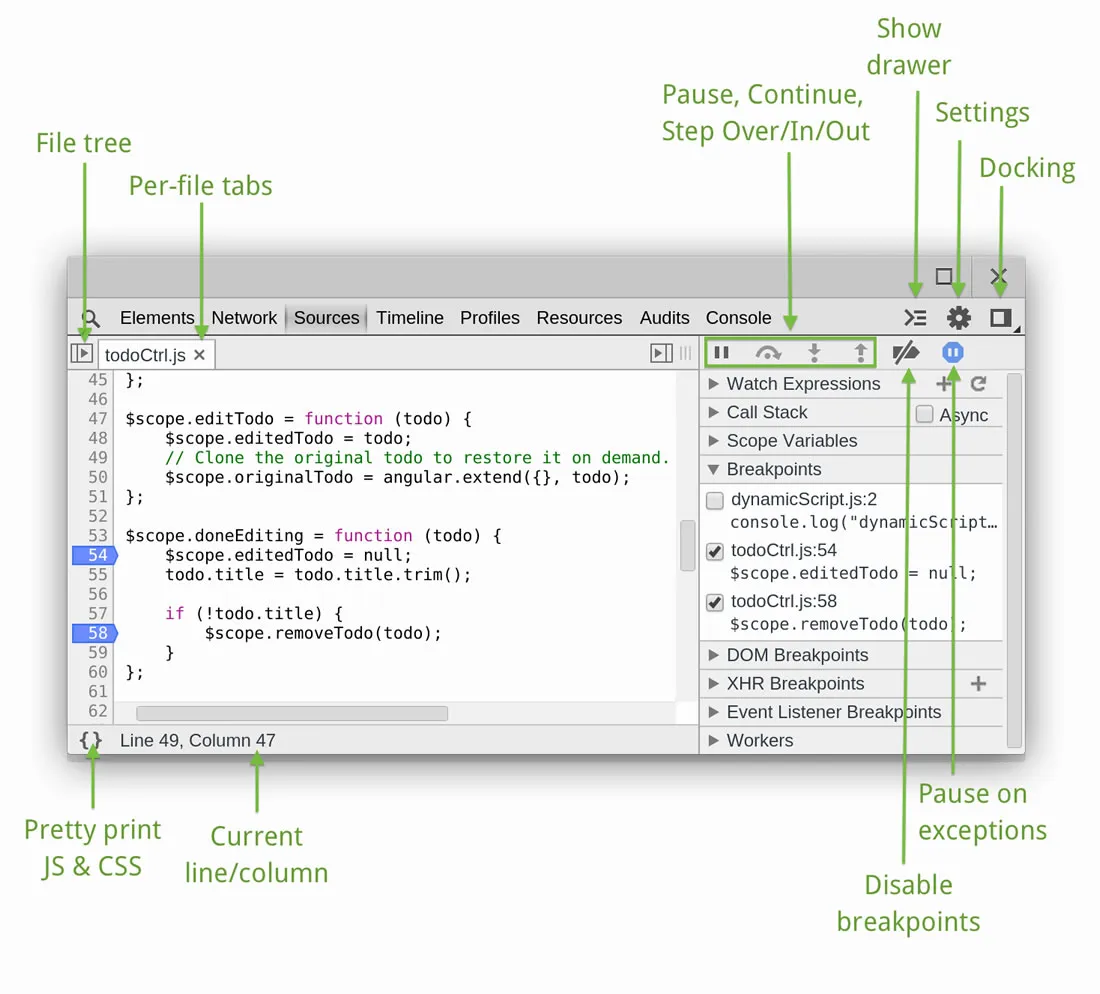
Sources

The sources tab is important, but I believe you should first master both the console and elements tabs. The sources tab shows you the raw HTML, CSS and JS files that were loaded in the browser. It is important to understand how this differs from the elements tab. The elements tab is the current state of the DOM in memory. The sources tab shows the files that were used to generate that DOM. In other words, if you have Javascript that dynamically modifies the DOM (think React / EmberJS), you can see your JS code in the sources tab but it might not be in the elements tab.
The sources tab is also an excellent place for debugging. Here we can set breakpoints in any file the browser has access to. Reload the page, and whenever that breakpoint is hit Chrome will suspend execution until you click step forwards.
As a result, when building SPA style applications - much of your debugging will happen in the sources tab because here you can view your original code before it is fed into the DOM and manipulated by whatever SPA framework you are using.
Network

The network tab is important in its own right, but is a bit more self explanatory. When firing API calls, (e.g. JQuery AJAX or vanilla JS XHR) you can see both the sent data and the response in this tab. It works very similar to a dumbed down version of Postman in some regards. You can also configure it to show you when CSS / JS / Media files load in over the network, which is useful for troubleshoot slow load times.
After a network transaction, you will see a short string representing the transaction appear on the left hand pane. If you click on this you can get more details. Most importantly:
- Status Codes
- Response and Request Headers (frequently used for things like authorization)
- Cookies
- Timing / Duration Waited
When building up applications that make frequent requests to the server, you can also use the performance map at the top of the tab to gauge how to better optimize your application. Frequently, you will find bottlenecks here like:
- Making many calls to the same API from the same page (solution: cache)
- Making many calls synchronously rather than async (solution: Async Semaphore or Promise.all)
- High latency calls due to geography (solution: CDN)
Generally speaking, when not used for checking the status / payload of a call - this will be used primarily for performance testing. Remember, most front-end performance bottlenecks are not in the algorithms but in the API calls!
Performance
The performance tab is the developer tools’ built-in profiler. Rather than showing you the current state of your application like the elements or sources tabs - this tab records what the browser was actually doing over a span of time, so you can scrub back through it and figure out where things went wrong.
You will spend most of your time here trying to track down performance issues that aren’t immediately obvious from the console or network tabs. Things like:
- Janky scrolling or stuttery animations
- Long blocking tasks that lock up the main thread for hundreds of milliseconds at a time
- Layout thrashing - where reads and writes to the DOM are interleaved in a way that forces the browser to constantly re-calculate layout
To get started, hit the record button, perform the action you’re trying to debug, then hit stop. Chrome will give you a flame chart showing exactly what was running on the main thread during that recording. The wider a bar, the longer that function ran.
Most useful in here:
- The frames timeline at the top - each colored bar represents a rendered frame, and you want them all to fit inside 16.7ms (60fps). Anything red is a dropped frame.
- The main thread flame graph - scripting (yellow), rendering (purple) and painting (green) all show up here. If scripting dominates, you have a JavaScript bottleneck. If rendering dominates, you’re probably forcing too many reflows.
- Bottom-up vs Call tree views in the lower pane - bottom-up sorts functions by time spent inside them which is great for finding hot functions, and call tree shows you the actual call stack so you can see who was calling what.
If you’ve never used this tab before, start by recording a 5-second scroll on your application. You will almost always find at least one function that’s slower than it should be.
Memory
The memory tab is where you go when your application keeps eating RAM and you can’t figure out why. This is particularly important for SPAs which can run for hours without a full page reload, and so have plenty of opportunities to leak.
There are three main tools in here:
- Heap snapshot - takes a complete snapshot of the JavaScript heap at a single moment in time. Useful for finding which types of objects are taking up the most memory.
- Allocation instrumentation on timeline - records allocations as they happen. Useful for finding which functions are creating the most garbage and how often.
- Allocation sampling - a lower-overhead version of the above, suitable for longer recording windows when you don’t want the profiler itself to skew the data.
The most common workflow looks like this: take a heap snapshot, perform the action you suspect is leaking (e.g. opening and closing a modal 10 times), take another snapshot, and then compare the two. Snapshots can be diffed in the “comparison” view to show you exactly what objects were created and never cleaned up.
One particularly common leak in JavaScript SPAs is the detached DOM tree. This is what happens when you remove a node from the DOM but still hold a reference to it in a JavaScript variable - the browser can’t garbage collect the DOM nodes because something in your code is still holding on. In a heap snapshot, filter for “Detached” to find these.
Generally speaking, if your application’s memory usage grows in a sawtooth pattern that resets every now and again, you’re probably fine - that’s just normal garbage collection doing its job. If it grows continually over time without dropping, you probably have a leak.
Application
The application tab is a catch-all for everything the browser is storing on behalf of your app. This includes localStorage, sessionStorage, cookies, IndexedDB, the service worker cache, and the manifest if you have a progressive web app.
Most of the time, you’ll be here for one of three reasons:
- Debugging client-side state - you set a value in localStorage and want to verify it’s actually there, or you want to manually edit a value to test a specific application state without writing additional code.
- Debugging cookies - particularly when working with authentication or cross-origin requests. The cookies sub-tab shows you each cookie alongside its HttpOnly, Secure, SameSite and Domain settings. If your login flow isn’t working, this is usually where you start looking.
- Service workers and cache - PWAs store their assets in the cache storage API. The service worker pane lets you unregister, update or bypass the active worker, which you will need very frequently while developing a PWA because stale service workers are one of the most frustrating debugging experiences in modern web development.
A useful trick here: you can right-click on a localStorage entry or a cookie and clear it on the spot, without writing any code. This is great for testing onboarding flows or any “first visit” logic.
Beyond storage, the application tab also shows you your web app manifest if you have one. If you’re targeting installable PWA status, this is where Chrome will tell you exactly which manifest fields you’re missing or have malformed.
Security
The security tab provides various security insights regarding the page you are currently on, and is a quick way to verify that the page is being served correctly over HTTPS, has improperly configured cookies, or is spawning browser security warnings due to app misconfigurations.
The main view shows you a summary - whether the connection is secure, whether the certificate is valid, and whether any of the resources on the page were loaded over an insecure (non-TLS) connection.
There are a few specific things you’ll come here for:
- Mixed content - if you serve your page over HTTPS but load any sub-resources (images, scripts, stylesheets) over plain HTTP, the browser will block them or downgrade them, and your page will misbehave. The security tab gives you a list of every offending resource so you can fix the URL.
- Certificate validation - clicking on the main origin shows you the full TLS certificate. Useful when working with a staging environment or a self-signed cert that you need to debug.
- Origin breakdown - the left hand pane shows every origin that contributed a resource to the current page, and the security state of each. This is helpful when your page pulls from many third-party origins and only one of them is the problem.
One of the most common use cases for this pane in the developer tools is trying to figure out which sub-resource is dragging the page down to “not secure”, or in otherwords some data is mixed content and not being served over SSL/TLS.
Audits

The audits tab runs Lighthouse, an automated set of checks against the current page covering performance, accessibility, best practices, SEO and progressive web app conformance.
Unlike the other tabs - which are reactive tools you use while debugging something specific - audits is proactive. You run it on a page when you want to know what’s wrong with that page, without yet knowing what to look for.
Each audit category gives you a score out of 100 and a list of specific issues. The most common categories I run are:
- Performance - identifies render-blocking resources, unused CSS / JS, oversized images, and other things slowing down your initial load.
- Accessibility - checks for missing alt text on images, low contrast text, missing form labels and improper heading hierarchy. This is one of the highest-ROI categories to fix, since most of the issues take five minutes each.
- Best Practices - covers things like deprecated APIs, console errors, mixed content and unsafe links (e.g.
target="_blank"withoutrel="noopener"). - SEO - checks for missing meta descriptions, broken canonical tags, robots.txt issues and other things that hurt your search rankings.
- PWA - if you’re building a progressive web app, this category will tell you whether your site qualifies for installability and offline support.
One important thing to note: Lighthouse runs against the current state of the page, so make sure you’re testing in an incognito window with no extensions enabled. Extensions can throw off both the performance score and the best-practices score in ways that are not always obvious.
If you’re handed an existing application and asked to “make it faster” - this is the best starting point. The performance audit will give you a prioritized list of what to fix, and you can work your way down it instead of guessing where the bottleneck is.